

OData API: Power BI Report with ABB Ability™ History
Step by step guide to create Power BI report using ABB Ability™ History OData API.
- Create a new Power BI report file ex: PUMP.pbix
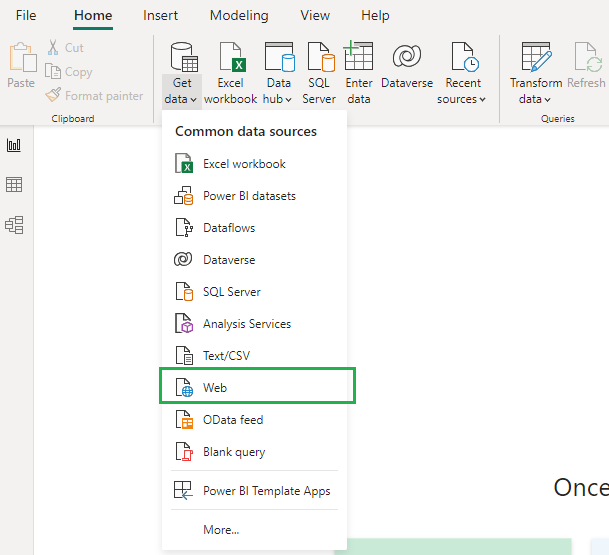
- In Power BI desktop application, go to Get Data menu item and select Web, as shown below.
- Select Basic radio button
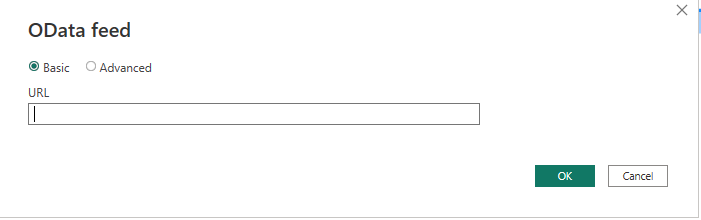
- Enter the oData query as referenced in the OData API documentation and click on OK button.
- OData Sample Query:
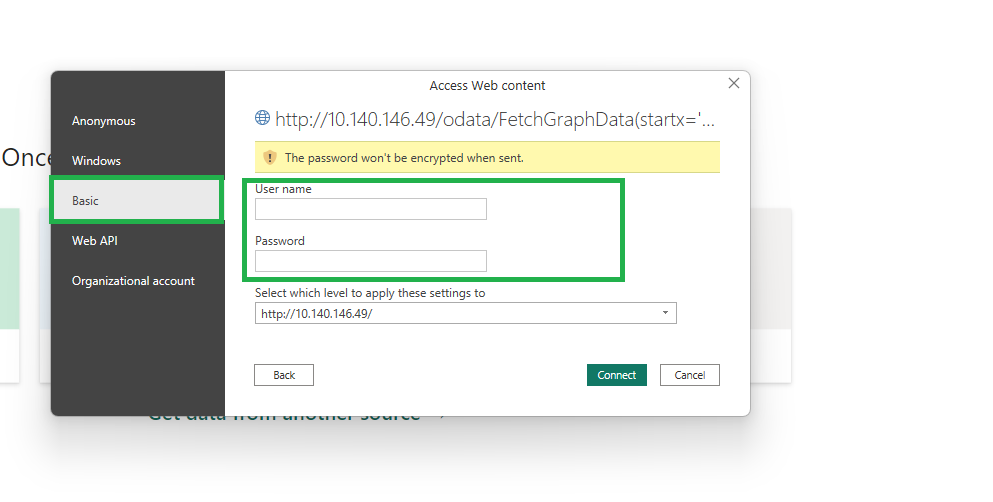
http://localhost/odata/FetchGraphData(startx='2023-10-27T00:00:00',classname='EquipmentHistory',endx='2023-10-27T00:30:00Z',wherestring='Path=%3F%20AND%20Property=%3F',whereargs=['Cars.FuelType.Petrol.Maruti',%20'RPM'],filter='AVG1min')- Select the authentication method as Basic and provide the credentials to connect to the RTDB data source.
- Click on Connect button to execute the oData Query. On execution the OData query loads the Data Transformation window as shown below. The query result is converted as Power BI Table automatically.
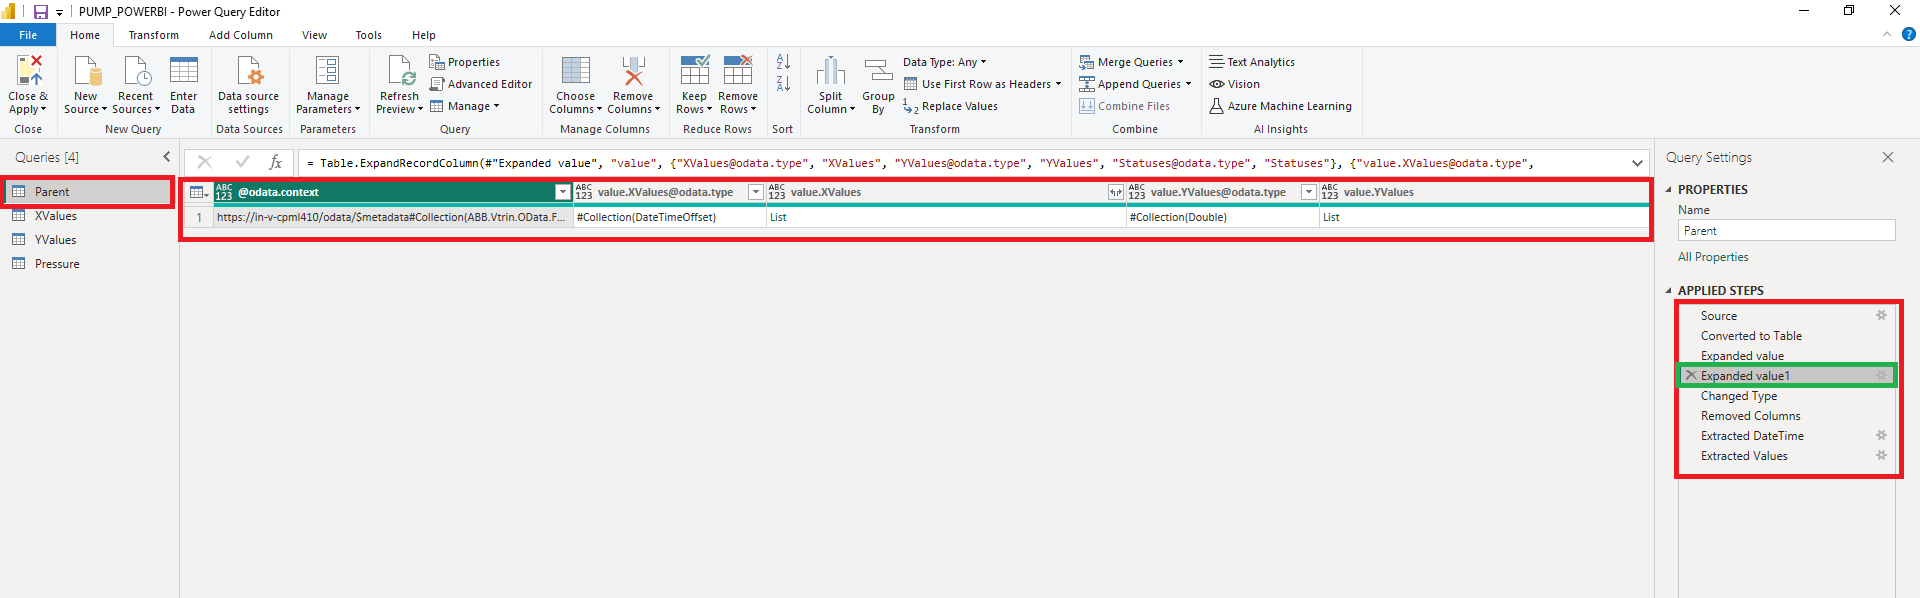
Parent table
- Now, transform the data source as per steps below:
-
Rename the data source. We named it as Parent, but this can be named as wished. All the JSON nodes will be shown as column names in the table.
-
Convert the Data Source to Table.
-
Expand Value column as Record.
-
Expand the Record in Value column.
-
Remove the unnecessary columns, ex: '@odata.context', '[email protected]', '[email protected]', '[email protected]', 'value.Statuses'.
-
Now in our table we have only 'value.XValues' and 'value.YValues' columns.
-
Extract the data in the XValues and YValues columns as it's separated by a ','
-
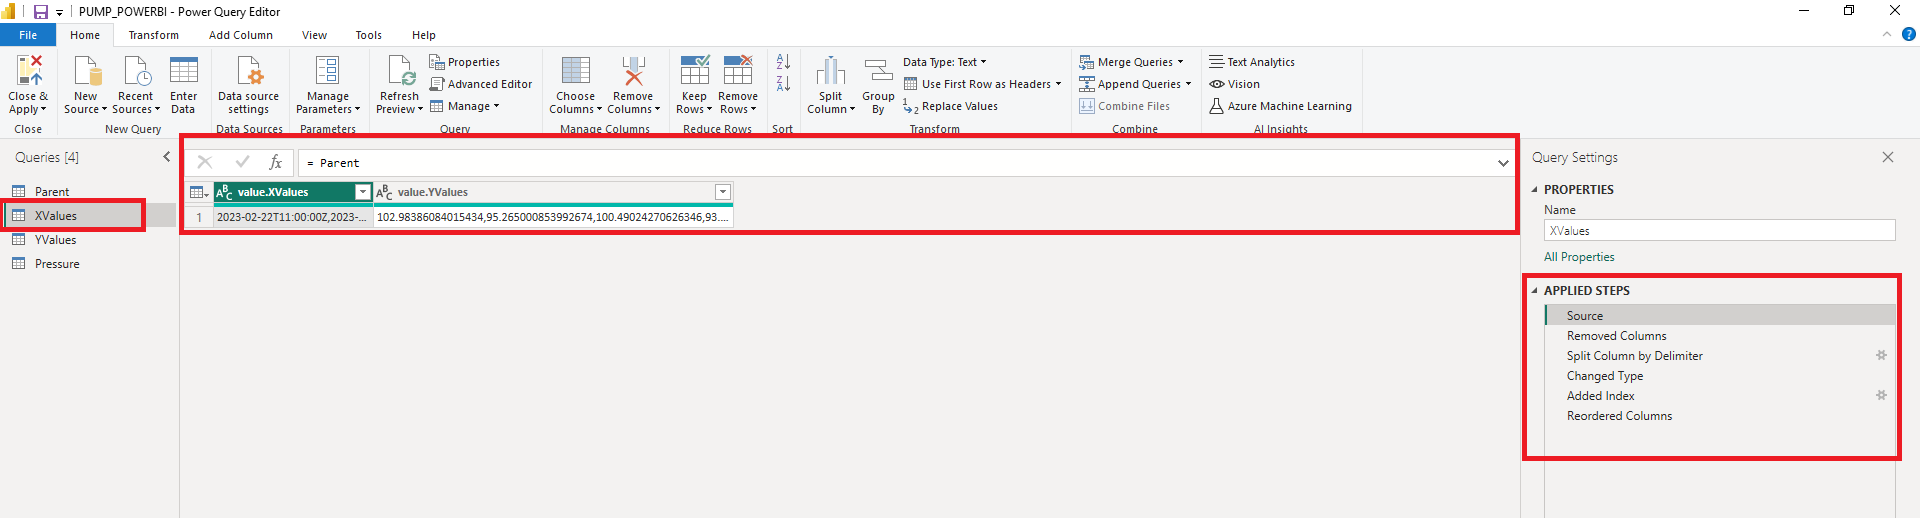
 Second table for XValues
- Next, we will create another table called XValues from the Parent table. This may be done with a few steps described below. Also shown on screenshot.
- Choose Source (In our case it is the Parent table).
- Remove YValues column.
- Split XValues column by delimiter.
- Change type.
- Add a new index column.
- Reorder columns.
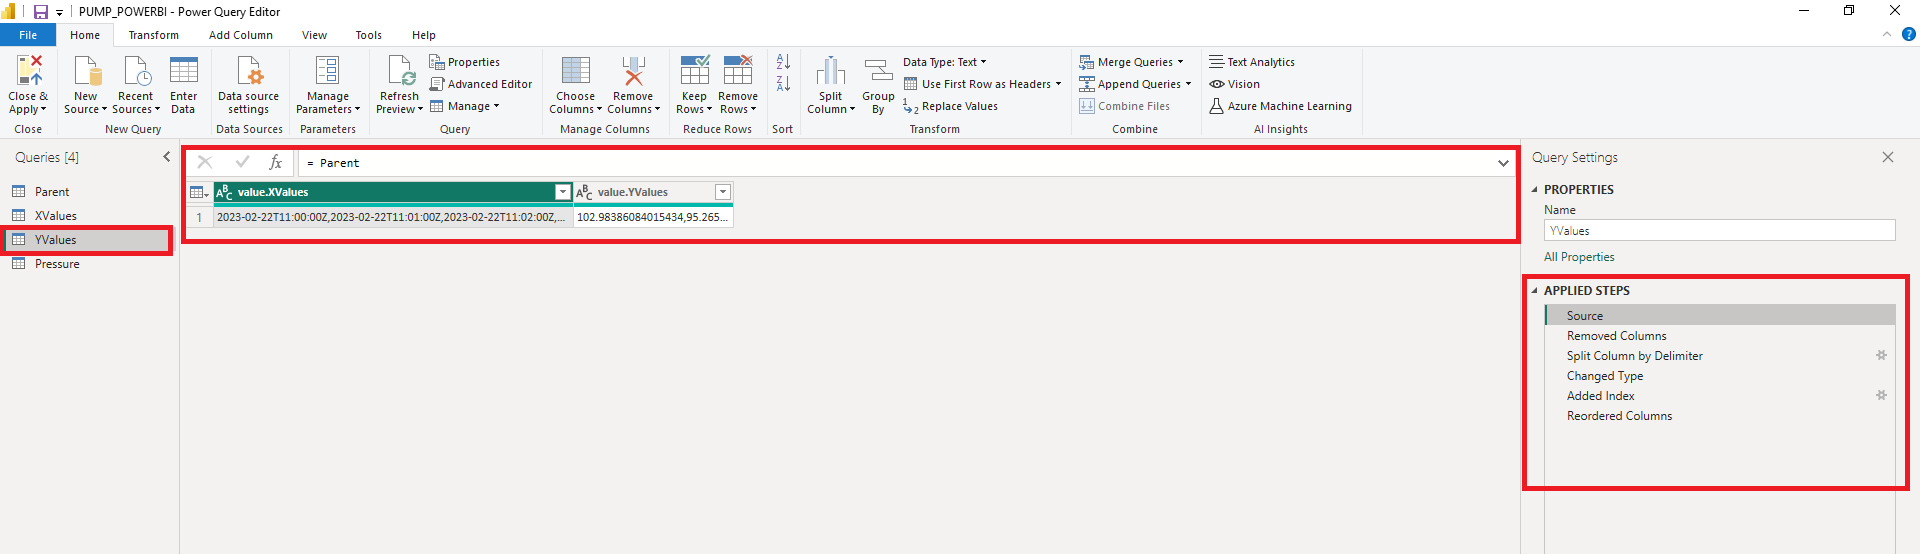
Third table for YValues
- Then we create another table from Parent for YValues and we will call 'YValues'. We apply similar steps here as with the XValues above. Steps shown below.
- Define Source.
- Remove XValues column.
- Split YValues column by delimiter.
- Change the type.
- Add a new Index column.
- Reorder the columns.
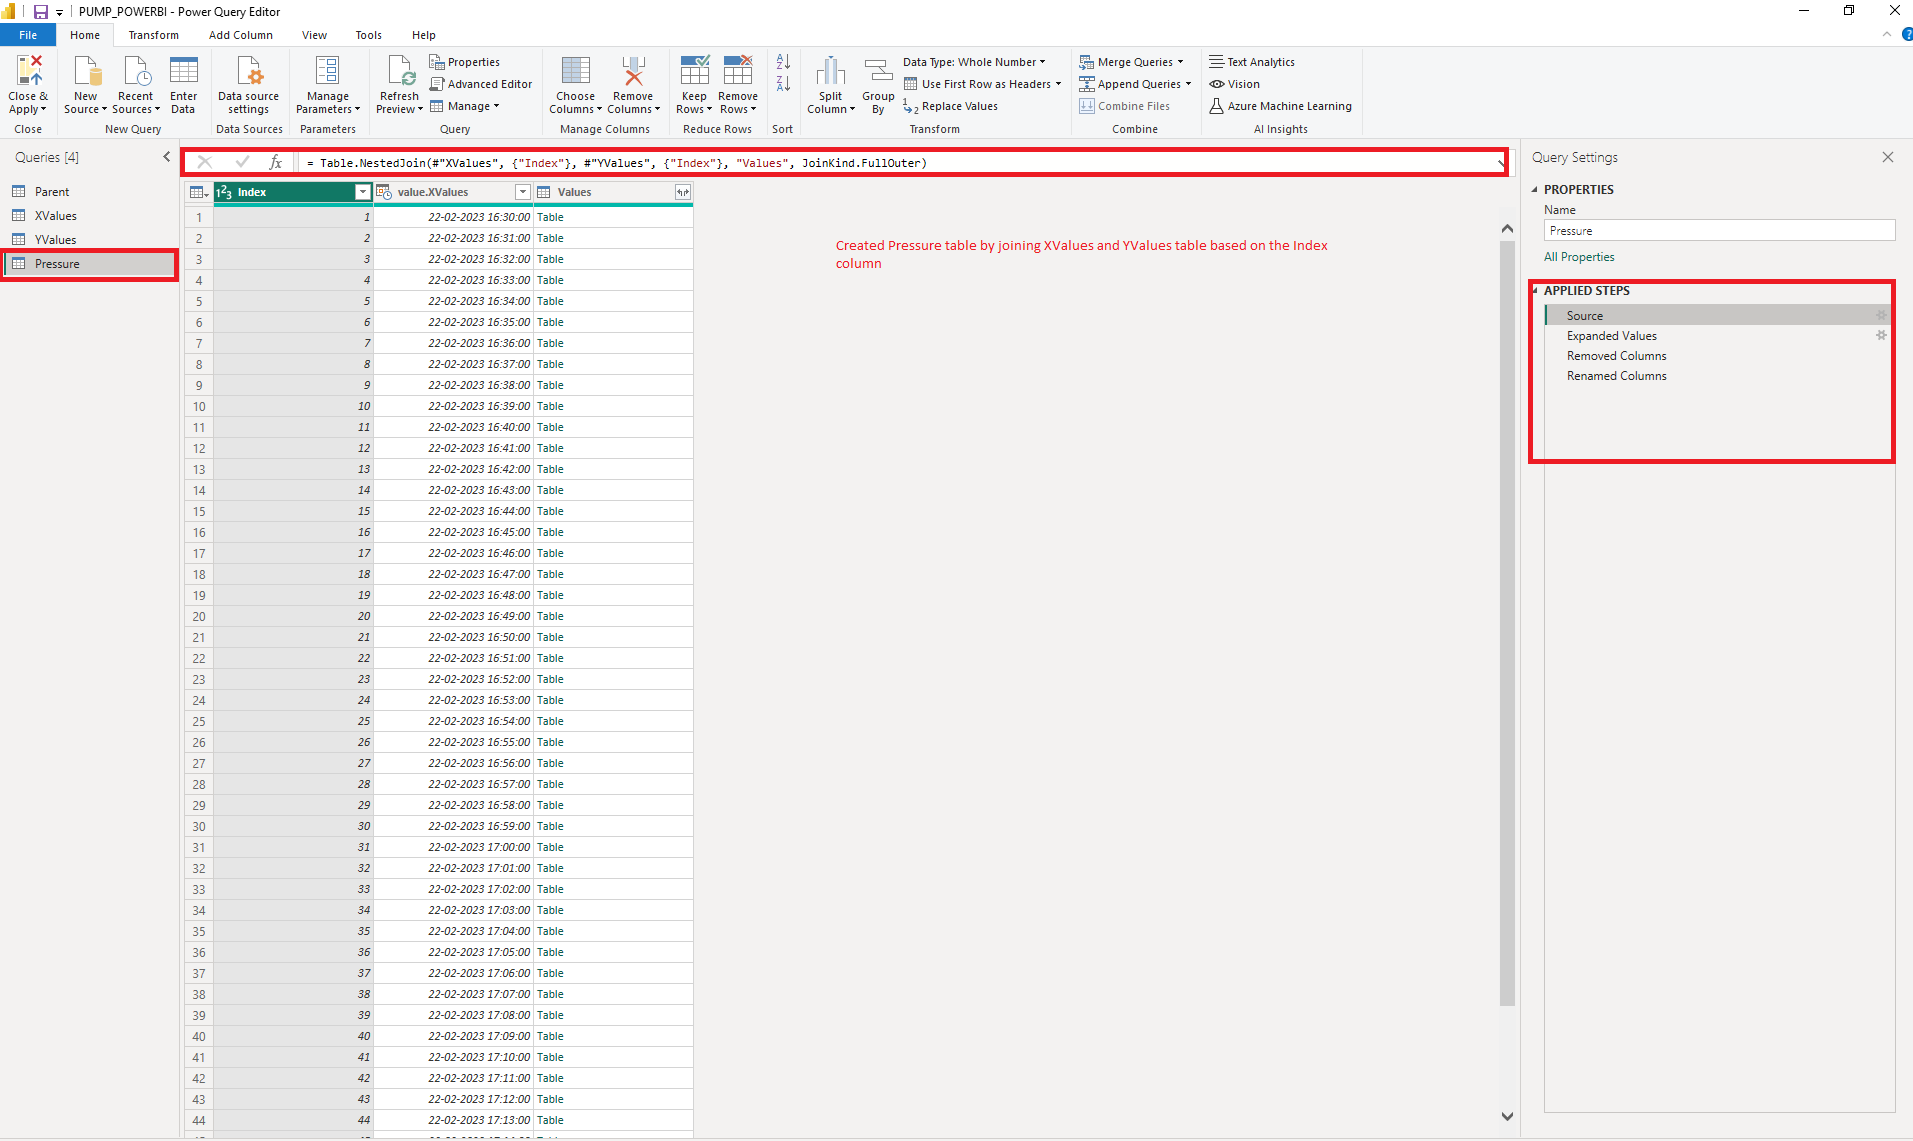
Fourth table for report
- Finally we create a table called Pressure by joining XValues and YValues table based on Index column. The data in this table is used to create the Power BI reports. The screenshot below will show further information including applied steps.
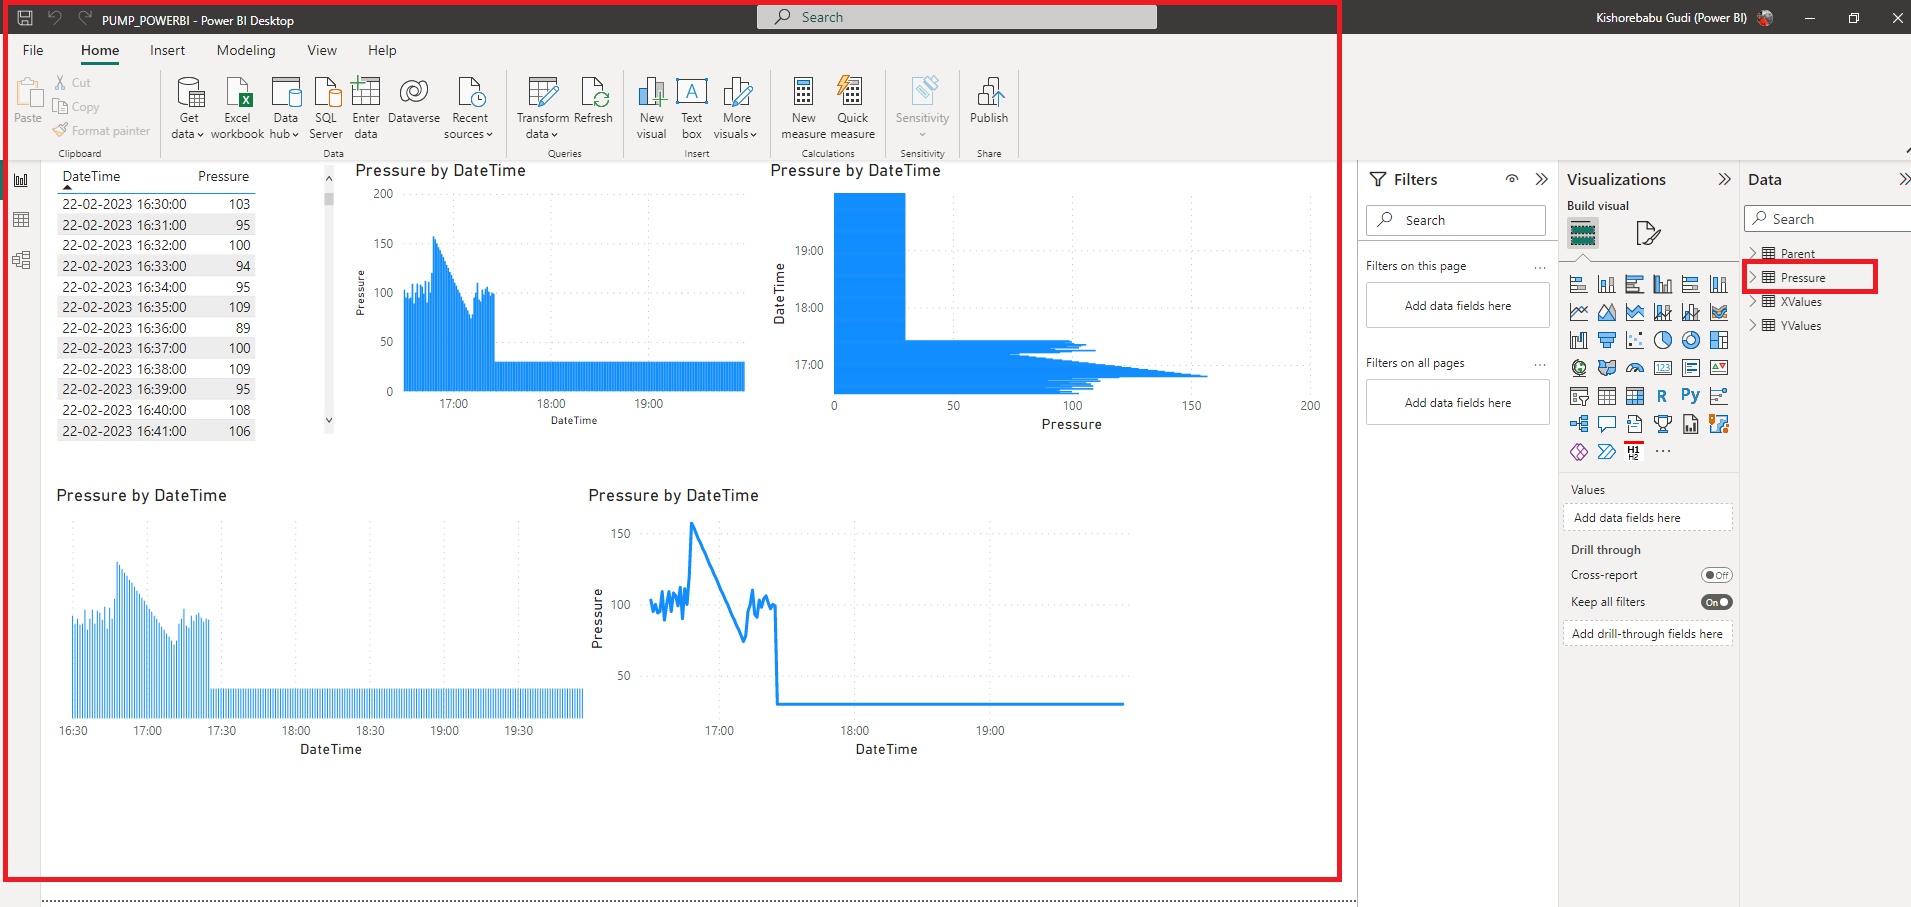
- Now we can navigate to Report view in the Power BI file we created in step 1 and create reports based on Pressure table.
Updated 6 days ago
Did this page help you?