

Monitor database size
Engineering UI provides an easy way to monitor your database size and this article will guide you through how to do it on Engineering UI.
First, navigate yourself to System > System Performance. This opens a dashboard, where all relevant performance data is displayed. Database size and table count is shown in the third box. From there you can open further details to trend from the top right corner icon or then on the third tab shown in the dashboard.
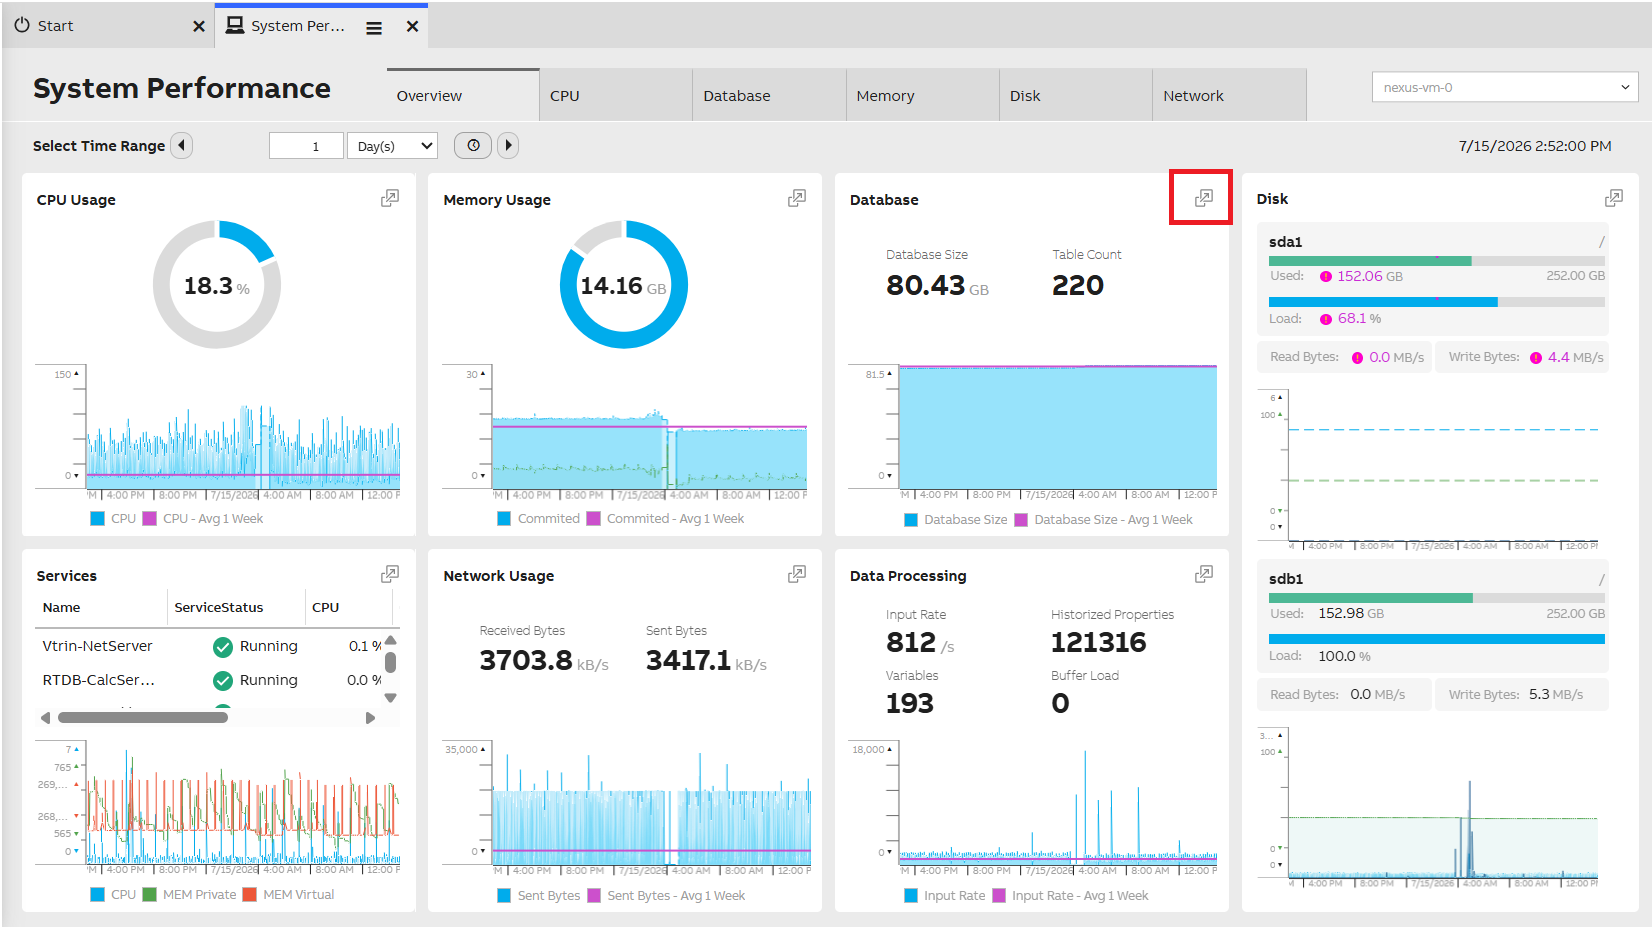
System performance display overview
The opening trend looks as image shows below. This has four properties:
- Input rate
- Buffer load
- Database size
- Table count
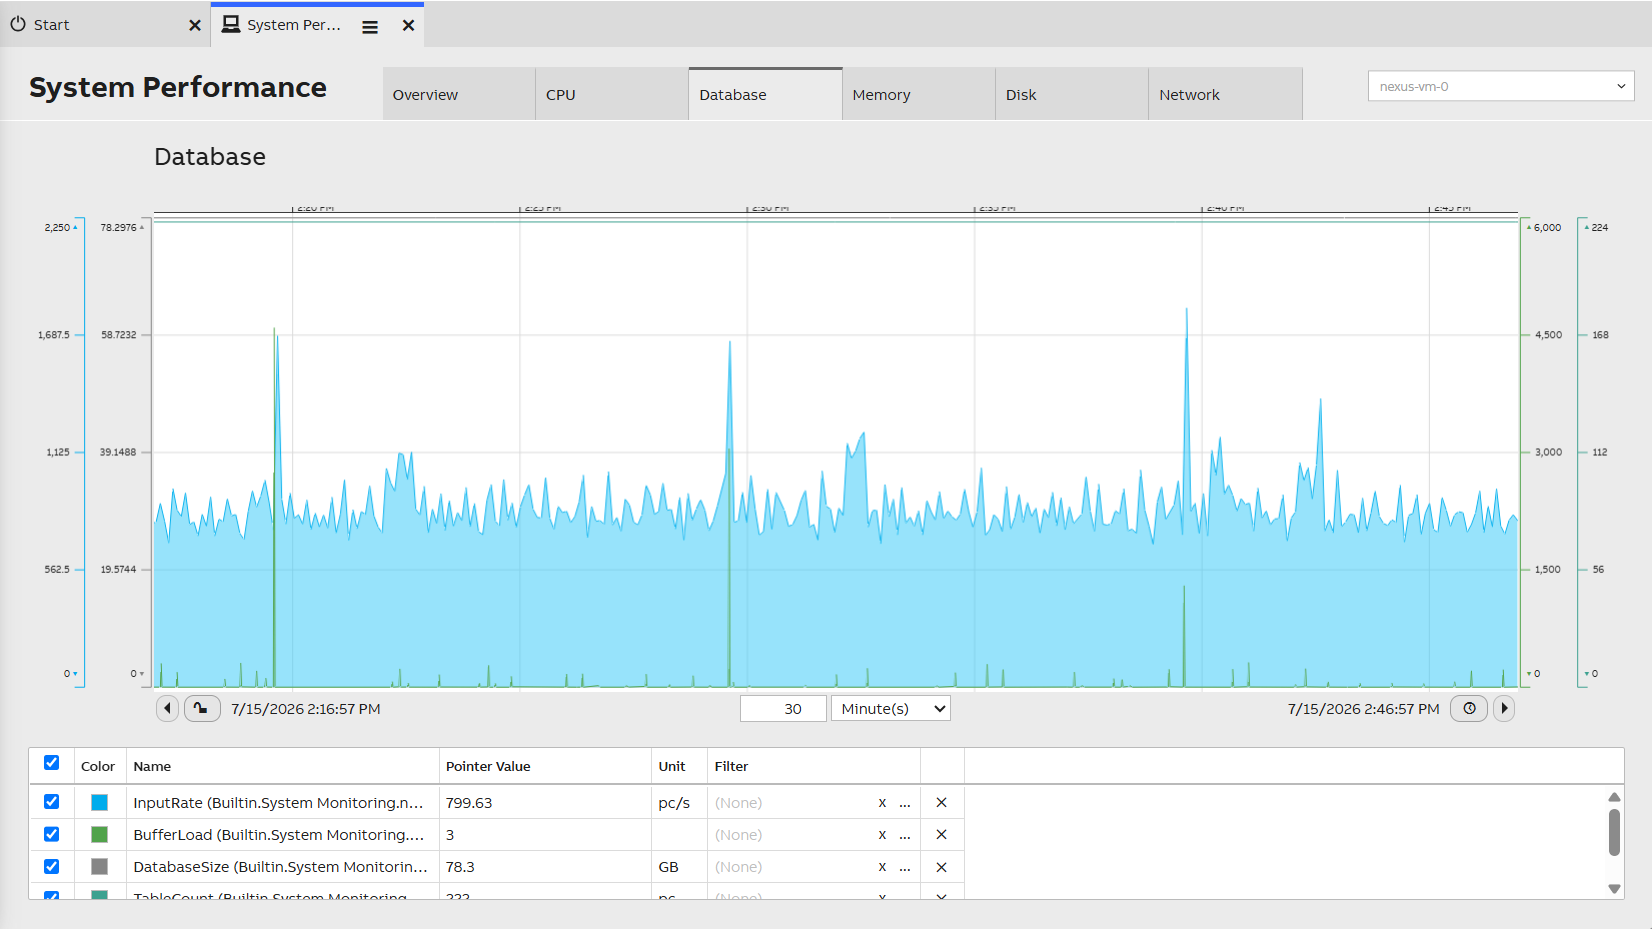
On this trend you can choose which of the data details are shown in the chart. This is done enabling or disabling the properties from the first column of the legend that is shown below the chart widget.
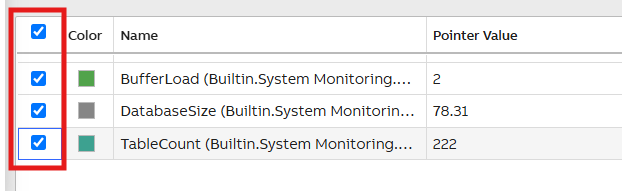
Changing time period of chart
You may change the time period of the trend on the timebar below the chart. This allows you to monitor longer or shorter time periods than the default period shows.
Updated 2 months ago