

Part 4 - User Interface
This article is part of the Batch application example
Lastly, to implement user interface to industrial application or solution, we will use our web browser tool View to create desktop like dashboards for monitoring our batch production system.
Creating a new dashboard
First, we navigate to the dashboard editor. It can be reached at https://{your History url}/view.
Next, we can open the TreeNode and add new dashboard(s) to selected folder. This can be done with right-click and from opening pop-up menu choose New -> Dashboard. For our example we will create four different dashboards explained below.
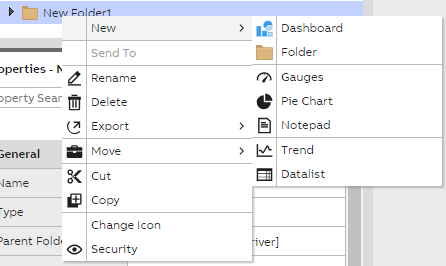
Creating new dashboard or other displays
Creating and modifying dashboard can be done in the edit mode and our widget library may be found by pressing the two square symbol in the toolbar menu. Widget menu shows all available widgets we can use and combine to build custom made monitors. More information on standard widgets may be found here.
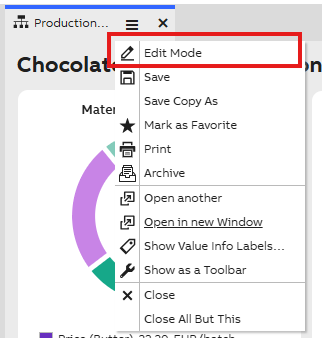
Dashboard settings menu
We highly recommend spending time testing the pinning and anchoring of widgets for best scaling results. This is especially important when building a dashboard with multiple widgets that might overlap when screen size changes.
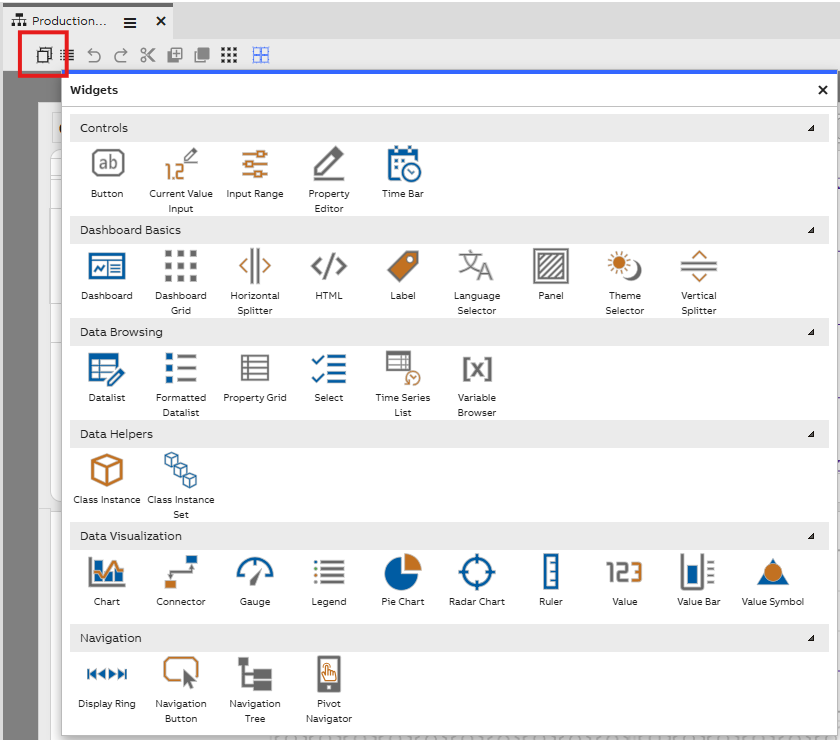
Widget library
Cookie Production Line Example
For our Cookie Production Line we created five monitors:
- CookieLine1: Allows us to monitor our production line process.
- Production planning: Allows us to plan and manage our production line recipes and ingredients within.
- Production monitoring: Allows us to monitor key figures in our production line.
- Production reporting: Allows us to monitor production line batches within 1 day.
- Batch tracking: Allows us to trace key values of our production line based on batch id.
- Production quality monitor: Allows us to monitor oven temperatures and texture balance within batches.
CookieLine1 process monitor
On this monitor we show both what recipe is currently in production and the ingredient amounts of our recipe instances. This purpose of this monitor is to give and overview of our production line.
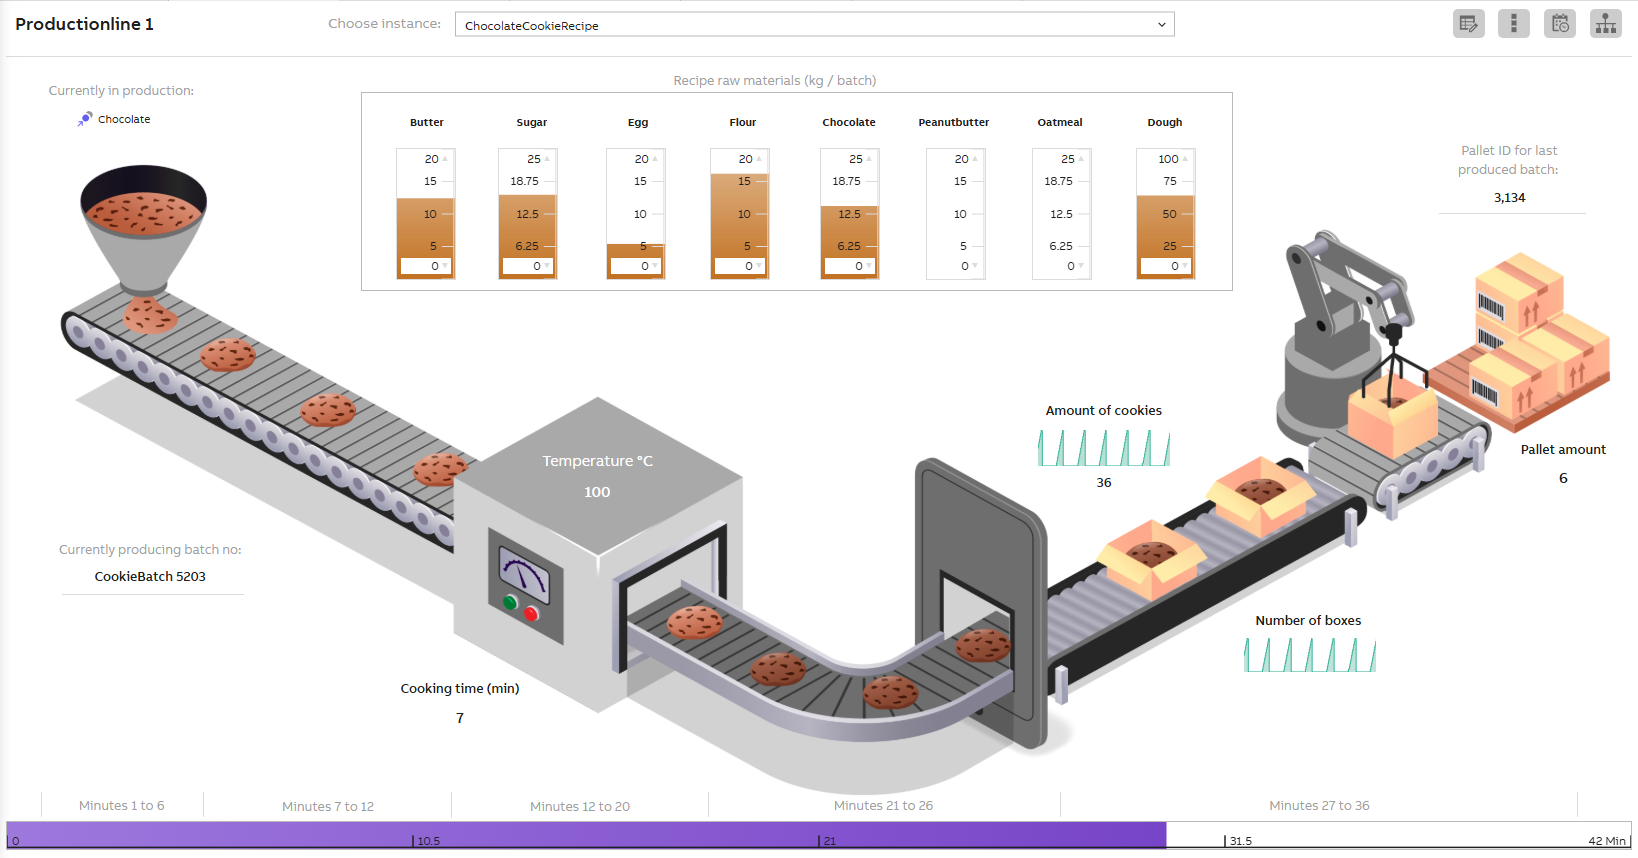
Widgets used on the dashboard
- Value bars: We use these to show our raw material amounts and to indicate production time progress.
- Labels: Used in headlines and explaining values.
- Value widgets: To display single property values.
- Chart widgets: To visualize the counters for amount of cookies and number of boxes in our packaging stage.
- Navigation buttons: These we use to include buttons for our other displays.
Production planning monitor
The second part of our batch production monitoring and planning is to create a recipe plan dashboard. For this demo we designed a dashboard where user can:
- Manually create the recipe plan.
- Monitor planned recipe production.
- Add new recipe instances and change the recipe ingredients, if needed.
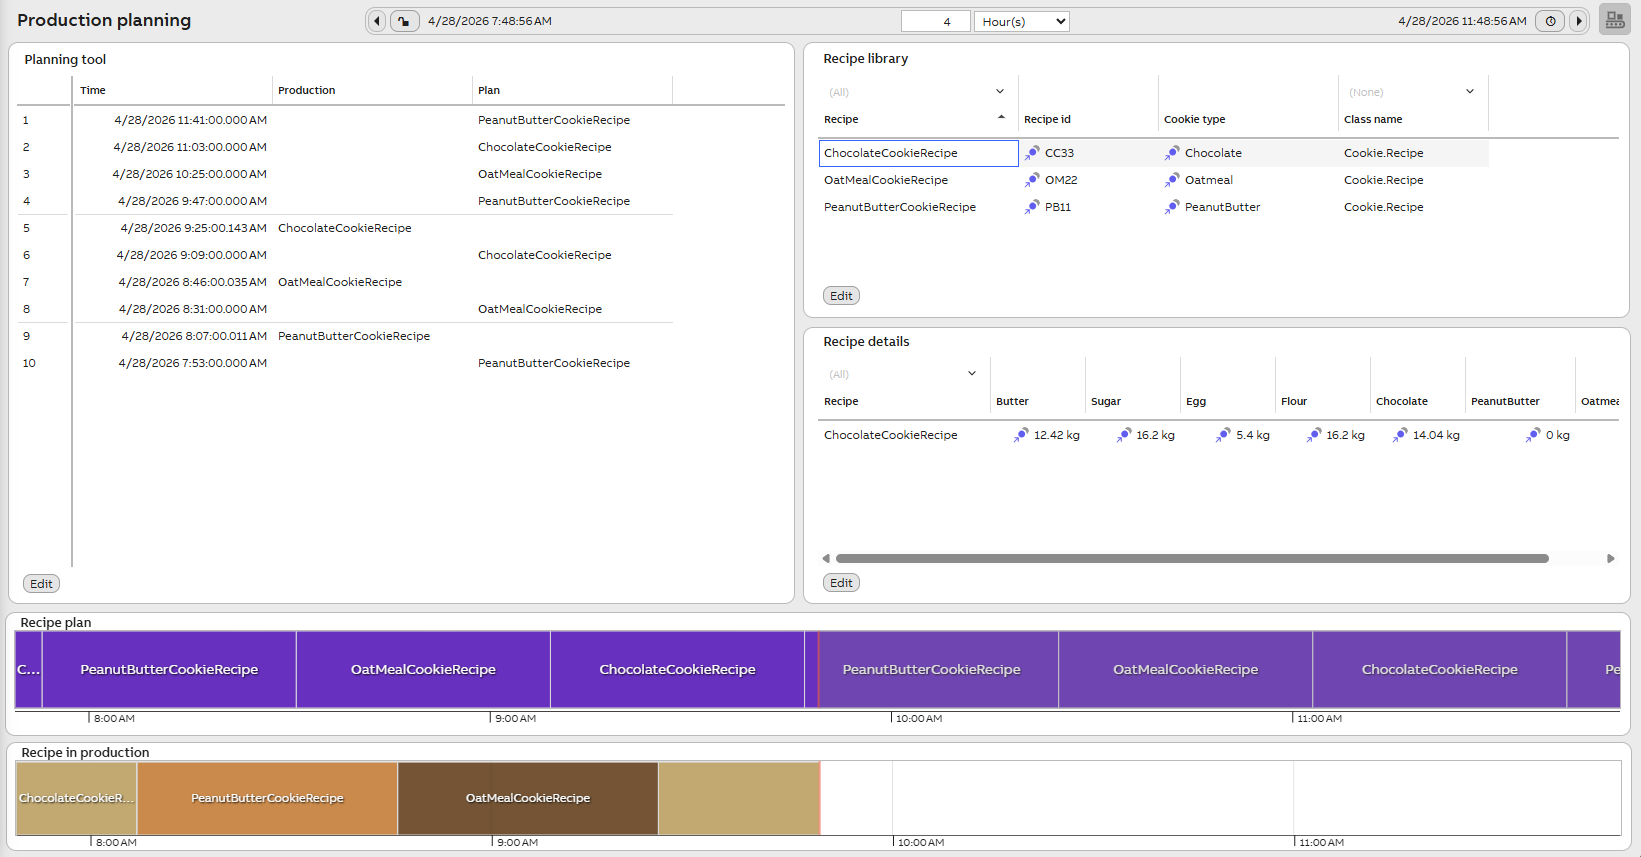
Editing production plan
Timeseries list editing allows us to set the time of start time and choose the recipe instance we wish. This way we are able to create our recipe production plan manually for future.

Widgets used on the dashboard
- Timebar: This is used to set the timespan for our other widgets on the dashboard. We have configured the settings so that we can see two hours ahead and two hours past.
- Time Series List: To create recipe plan and follow when planned recipe production starts.
- Datalists: These we use for showing our recipe library and recipe details. The datalists are connected together in a way that our "recipe details" shows the ingredients of the selected recipe instance.
- Charts: Two charts allow us to visually monitor our recipe plan and recipe production.
Production monitor
The picture below shows our chocolate cookie line monitor that gives us an overview of main production line features.
The main values we follow on this monitor are;
- Production time (runs from 0 to 36 minutes).
- Material amounts per ingredient.
- Material prices per ingredient and overall price per one batch.
- Batch ID and Pallet ID.
- Temperature charts (Mixer, Oven, Packager).
- Number of bags and cookies in bag (counters).
- Cooking time (seconds).
We have also included a navigation button from which we can navigate to our single batch monitor.
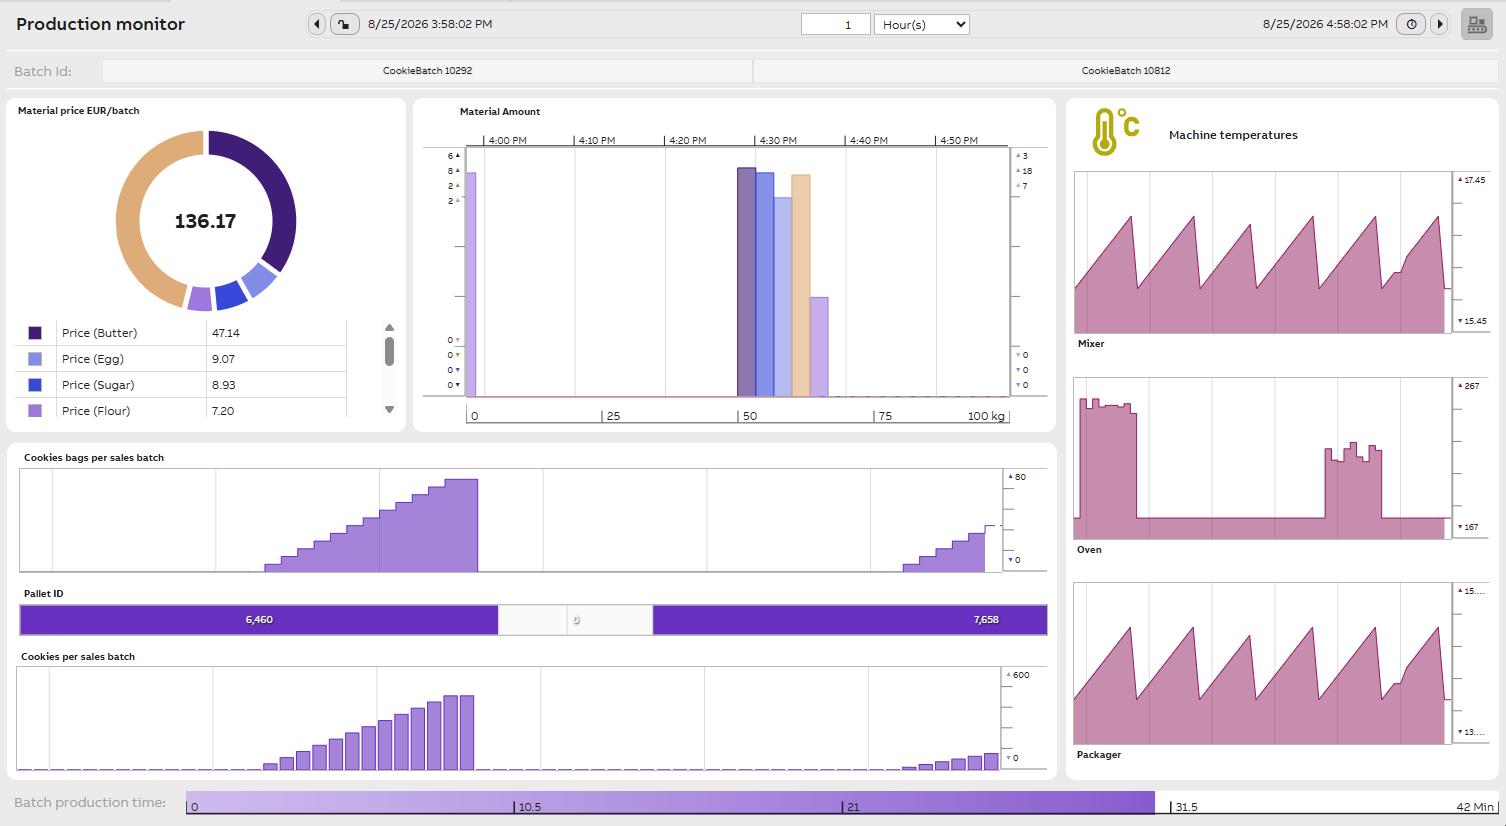
Chocolate cookie production monitor example
Widgets used on the dashboard
The widgets we used here are;
- Charts: These show; material amount changes, temperature changes for mixer, oven and packager, id changes for batch and pallets as well as cookie counts for packaging. There are several options for the type of how chart data is presented. In our charts we have used; grouped columns, trend and gantt type presentation.
- Rulers: Rulers are used with charts to show the value scale on charts. Rulers may be auto-scaled or then scale can be modified manually.
- Pie chart and value widget: Price values are shown in pie chart and the total price is shown on separate value widget in the middle of the chart.
- Legend: Shows the data added to the pie chart. Legend has fifty columns to choose from. In our example the legend shows property names, values and colors used in the chart.
- Timebar: Timebar is placed on top of the display and shows given time period. Time period may be easily changed from the timebar dropdown menus shown on the bar and on the timebar property settings. Timebar is attached to all our charts to show values within same time period.
- Labels: Labels include the headlines of our widgets. Fonts, backgrounds and sizes may be changed according to wishes.
*We also recommend using splitters if widget sizes need to be resizable. See further information on how to use splitters.
Daily production report
The picture below shows our daily production report monitor. With this we can audit and monitor our batch production within 1 day and detect possible abnormalities within production line.
Our daily report shows;
- Number of cookie bags produced.
- Number of pallets produced.
- Material prices per day.
- Material amounts per day.
- Cookie batches produced with start and end time, batch id, pallet amount, total material amount, energy consumption and production quality message.
- Production alerts with event time. These include reports related to production, personnel, maintenance and quality control. Note: We are currently developing a new reporting tool and will publish it in near future. Tutorial and further information for users will be provided.
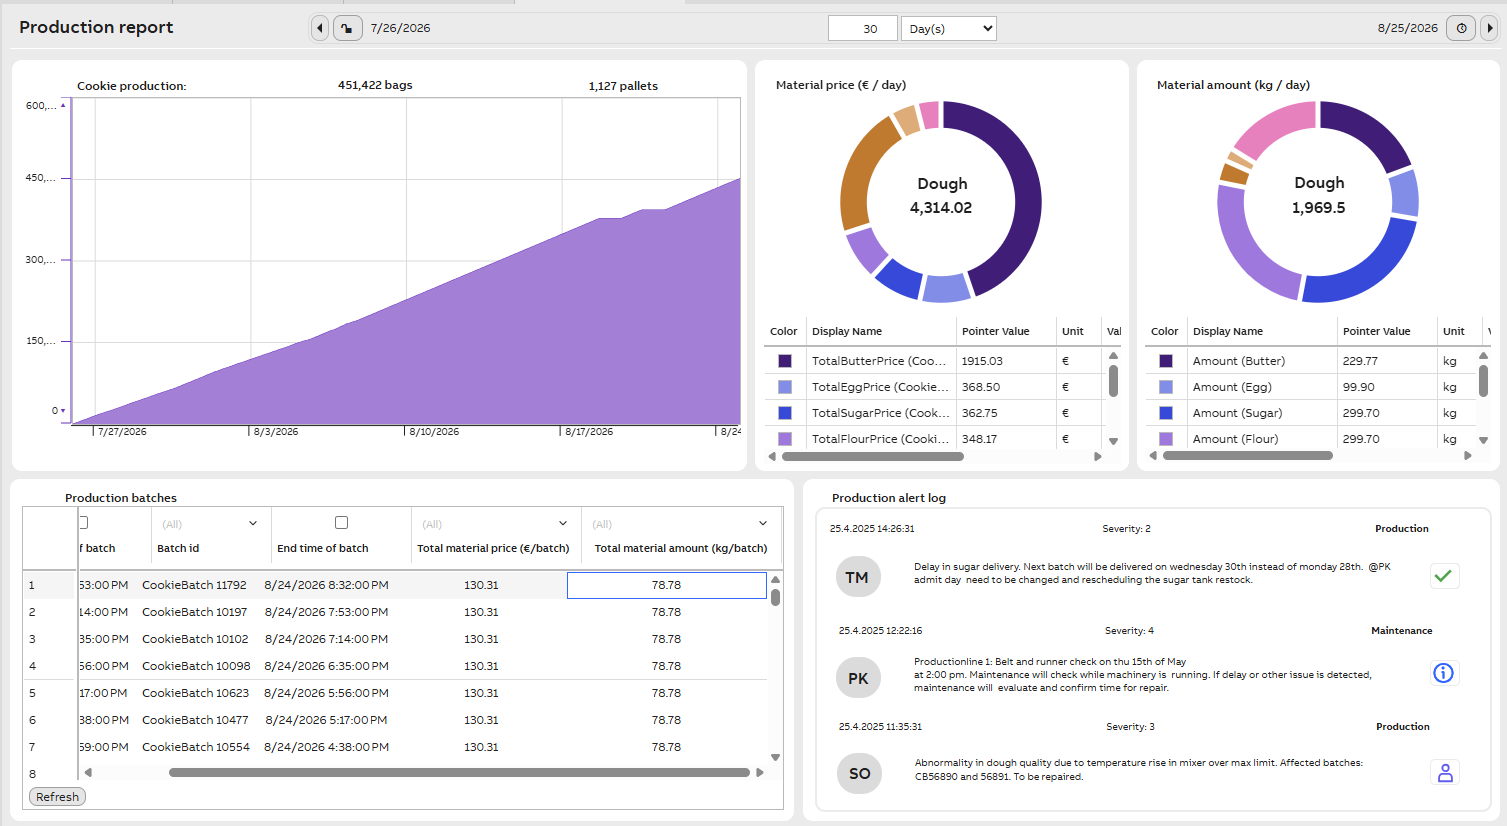
Daily production report example
Widgets used on the dashboard
The widgets we used here are;
- Trend chart to show cookies produced.
- Pie charts to show material prices and amounts per day.
- Datalist to show production log. This allows us to get a quick overview of batch production.
- Formatted Data List to show production alerts of devices. The visible data has been modified to fit our example needs. Formatted data list visualizes data from chosen data source and appearance may be modified as wished.
- Labels to show titles and property names for charts.
Batch tracking monitor
Our batch tracking monitor allows us to track single property value changes in our production batches.
Tutorial: We have done a separate how-to guide for creating a similar tracking dashboard. Read it here.
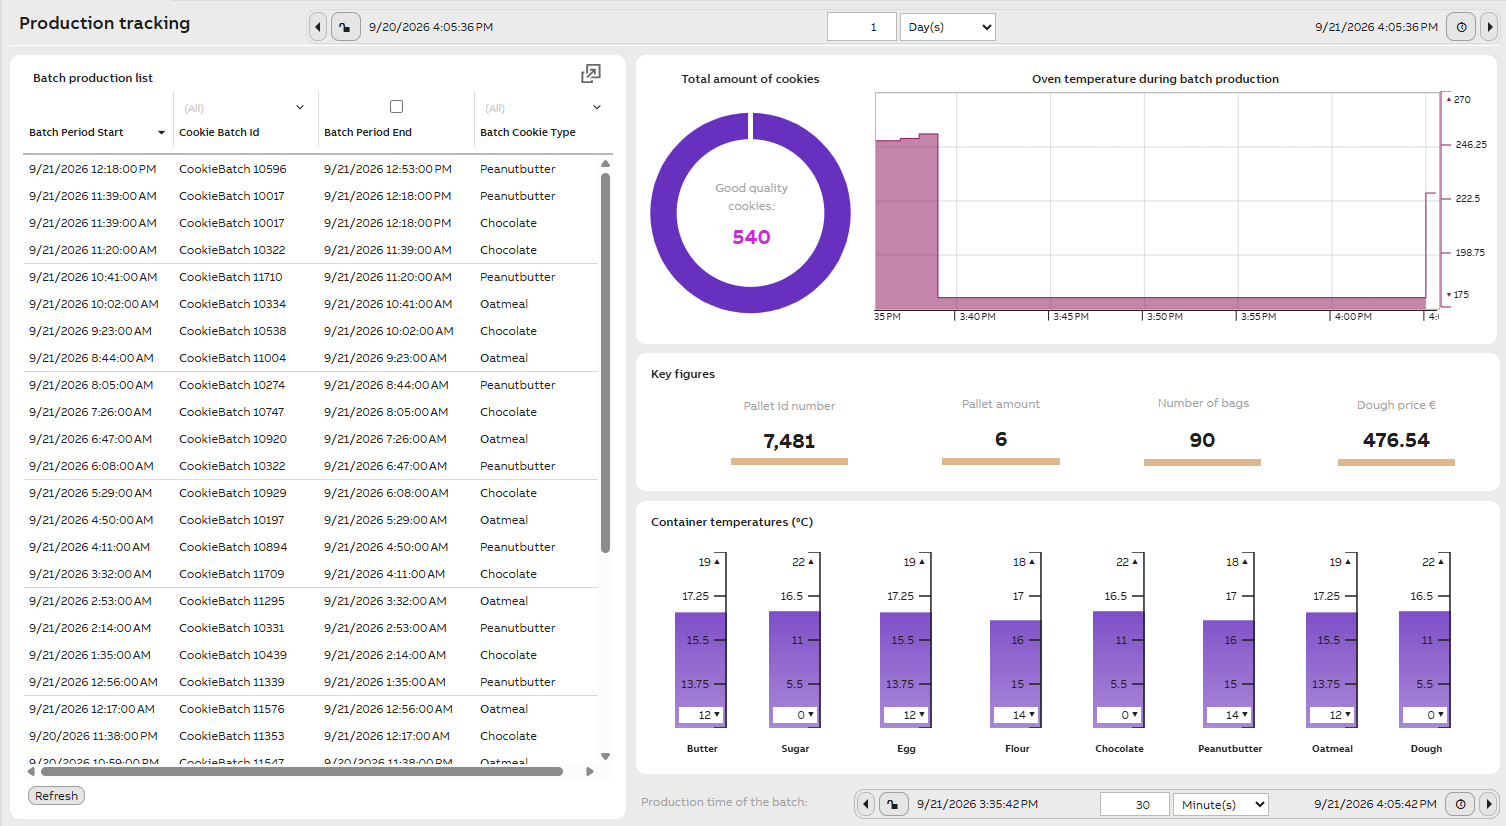
Cookie Batch monitor example
Widgets used in monitor
In this monitor we used the following widgets:
- Chart: We use two charts that shows selected data from our Equipment models.
- Ruler: We use rulers with our charts to show the number scales and time range.
- Label: Labels we use for headlines of our monitor and widgets
- Time bar: We have two time bars on the monitor. One that shows the overall time period of our monitor (placed below our datalist) and one that shows time period of each batch production. The second one is placed on top of our chart and when choosing batch id from the datalist, this time bar will show start and end times of that batch production as well as the overall production time in minutes.
- Datalist: On datalist we show batch id with start and end times.
Production quality monitor
Lastly, our production quality monitor looks as below.
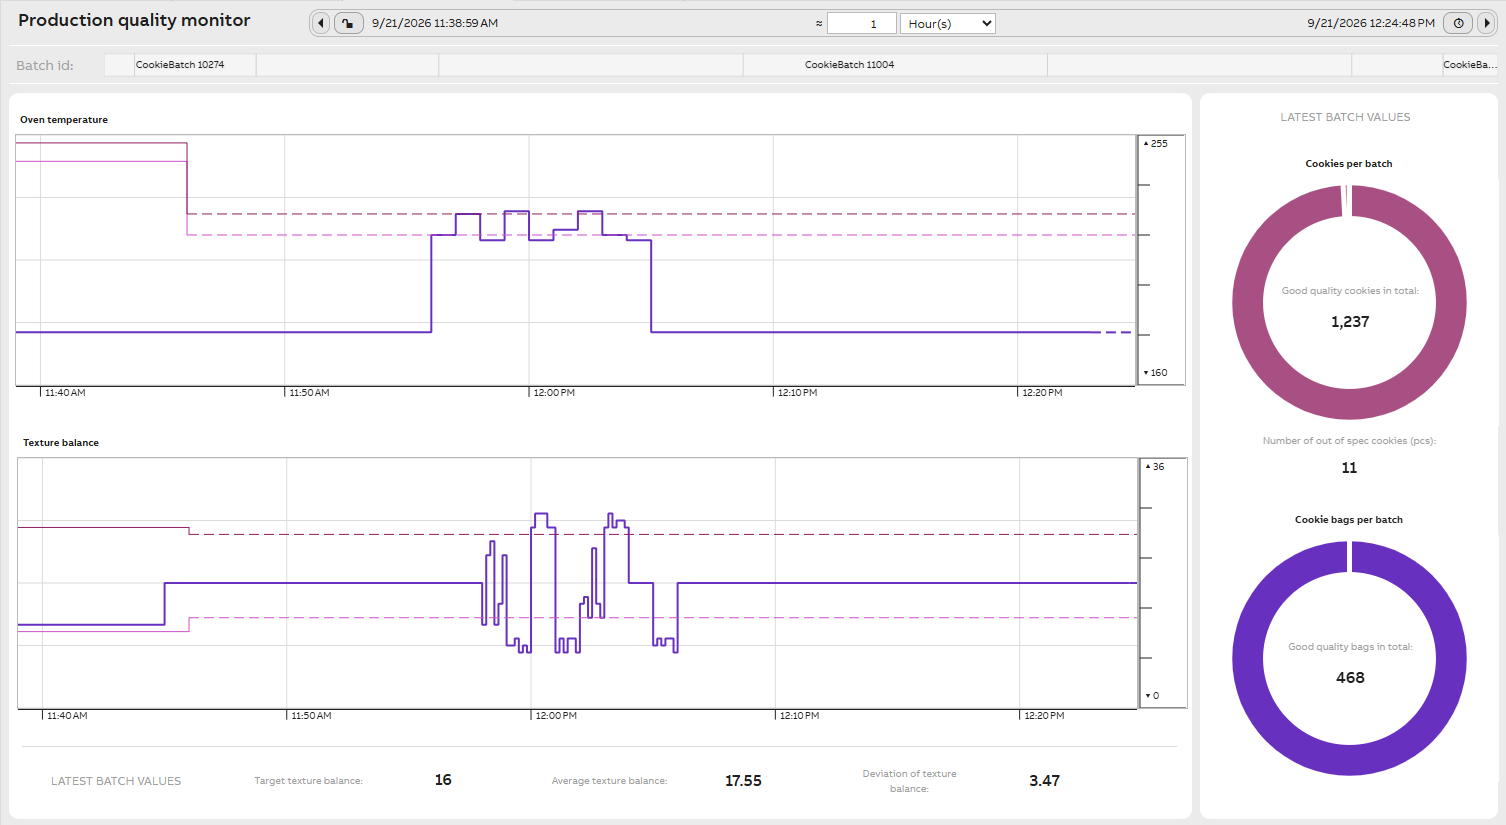
With this we are able to monitor oven temperature and texture balance changes. With the time bar we can choose different time periods.
Below charts we are also showing values of the latest batch. Especially interesting is how many cookies have gone to waste due to oven temperature changes and how many good quality cookies we got.
Widgets used in monitor
- Charts with rulers: Big charts in the middle are used to present oven temperature and texture balance values. The texture balance changes derives from oven temperature changes. Both charts also show minimum and maximum values for both properties.
- Timebar: Gives us the time period, which in this case is 1 hour. Charts are connected to this timebar.
- Value widgets: At the bottom of the dashboard we have added quality control values of the latest batch. This way we are able to trace quality differences between single batches.
- Gantt chart: On top of the charts we have also added a chart with our batch id to identify batches with possible issues.
Further information on user interface?Find user interface documentation about dashboard editor and step-by-step guide under Concept.
Find Trend display tutorial here.
Further information on most commonly used widgets you may find under Standard Widgets.
Documentation on dashboard features you may find under Dashboard features .
Updated 3 days ago